Loading 3D models...
Global Surface Temperature Anomalies - 2020
by calvmill in science-technology
237,968
Faces
119,144
Vertices
0
Textures
Free
Download
Description
This shows the mean surface air temperature anomalies for the year 2020 as compared to the base period means from 1950-1980. The topographies shown are scaled by a factor of 20 to be more prevalent. The data comes from a NASA GISS 5 X 5 curvelinear grid dataset with 1200km smoothing. The data was interpolated using the Python package xarray to scale the data by a factor of 64 prior to projecting it onto a polygonal mesh. Paraview was used to render this model. https://data.giss.nasa.gov/gistemp/ Temperature anomoly colormap (degrees Celsius) 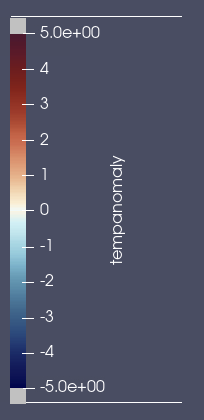
Technical Details
Related Models
Roman Terracotta Jar, Castilla-La Mancha, Spain
132,255 faces
Free

V.E.P. VI: Mobile Missile Defense Bastion
42,726 faces
Free
Porcine Elastase
109,314 faces
Free

TPMS PS {6,4|4}P - Free Download
3,428 faces
Free
Ground Stone Blade, XFP-074. Sanak Island, AK
1,549,010 faces
Free
Experiment paneling surface
412 faces
Free
STATUE PEDESTAL SUTORIA SURILLA - TARRACO
54,075 faces
Free
Blade, Sanak Island, Alaska XFP-054-23.9
79,978 faces
Free